Photovoltaic — plant monitoring
A plant that yields less does not stop. It just yields less.
powerPV reads the plant continuously and compares, every day, what it produced against what that day’s irradiation allowed. When the two numbers separate, you know that month — not at the year end.
Why it needs reading
The fault that costs most is the one that switches nothing off.
Everyone notices a total shutdown. The problem is the other kind: the loss that keeps producing, only slightly less, for months.
- 01
Nothing tells you
A string that opens, an inverter that tripped in the night and restarted itself, a diode leaking: the plant carries on exporting. Nothing sounds, and the meter turns just the same.
- 02
The standard measures, it does not diagnose
The checks prescribed for measuring efficiency say whether the plant meets its parameters. They do not say which module has a hot spot, or which subfield is losing current.
- 03
Comparing years acquits nobody
You produced less than last year. Was it a duller season, or has the plant aged faster than it should? Without irradiation measured on site, the question stays open.
- 04
Sampling averages the dip away
A monthly survey finds an average. The afternoon when yield collapsed for two hours goes into that average and disappears — and that was the reading that mattered.
The panel
One number, read against its own line.
An owner asks one question every morning: is the plant yielding what today allowed? The performance ratio answers it against the sun that was actually there — and the hourly bars say at what point in the day the answer changes.
- Energy produced today 3,140 kWh
- Energy consumed 318 kWh
- Irradiation 612 W/m²
- Module temperature 38.6 °C
- Ambient temperature 24.2 °C
Hourly PR
Sunrise 07:18 Sunset 17:34 Last reading from the field 17:05
powerPV The dashboard, as it actually looks
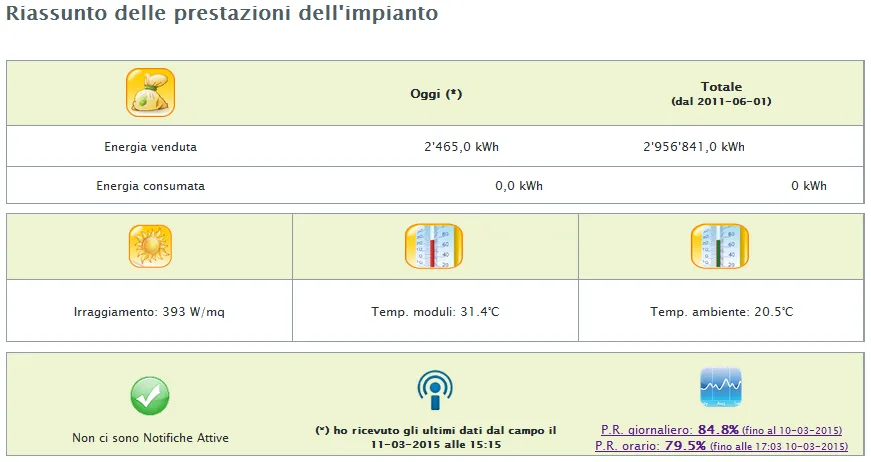
The plant performance summary on the powerPV platform. The same figures as the panel above — energy, irradiation, temperatures, daily and hourly performance ratio — on a plant in service. The revenue figures have been removed: a plant’s earnings are not ours to publish. Interface shown in Italian.
powerPV
Three layers: what sits in the field, what computes, what you look at.
powerPV is an analysis and control system for photovoltaic plants. It is not a display bolted to an inverter: it is a chain that starts at the field signals and ends in a panel you can open from anywhere.
- 1
In the field
Programmable controllers carrying the expansions needed to talk to the plant’s digital nodes: inverters, string boxes, smart sensors. Temperatures — ambient, module, technical room — come in through 4–20 mA transducers and are digitised. Above a megawatt peak there is more than one controller, and they talk to each other over a local network, usually fibre.
- 2
Acquisition
Data is taken at the highest rate the bus allows, averaged, and sent up to a central server. The field does not have to stay online for the reading to arrive: it accumulates locally and goes when it can.
- 3
Reading it back
A web service: live operating data and history, at any time, from anywhere. Credentials carry distinct profiles, so whoever runs the plant and whoever owns it each see what they need without seeing the rest.
What it reads
The quantities that, put together, explain a day.
Any one curve says little on its own. It is the comparison between them — and with the same days a week earlier — that makes it obvious where the yield went.
-
Inverters
Input and output voltages, currents, temperature, alarms. An interactive chart isolates one curve, compares several inverters, and lays previous days over the top. On large plants the energy figure can come from a reference meter, which is more accurate than the inverter’s own.
-
Strings
Current measured at the string boxes, plotted every fifteen minutes. Selection works at three levels: one box, every box in a subfield, or the mean of all of them. A box behaving badly stands out at once.
-
Daily integration
Integrating the significant current across a whole day exposes local losses that no single instant shows: not a fault, just a few points of yield below its neighbours.
-
Meters and reactive energy
Main and reference meters, plus a section for the reactive energy produced — which does not appear on the export invoice but does appear on the distributor’s.
-
Environmental sensors
Irradiation, module and ambient temperature, technical-room temperature, wind. Without irradiation measured on site the performance ratio is an estimate; with it, it is a measurement.
powerPV Inverters and strings, on the platform
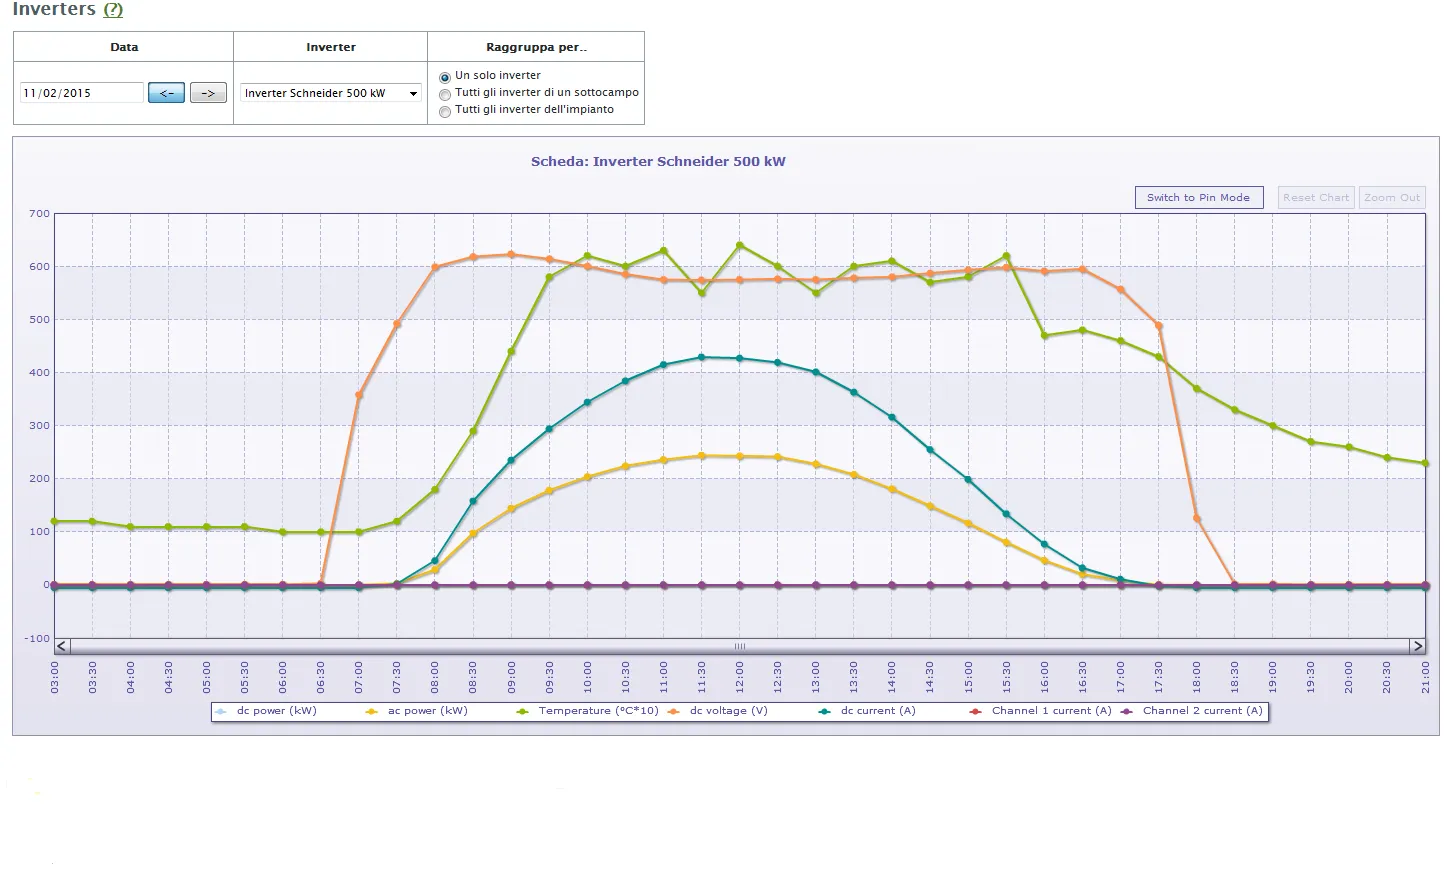
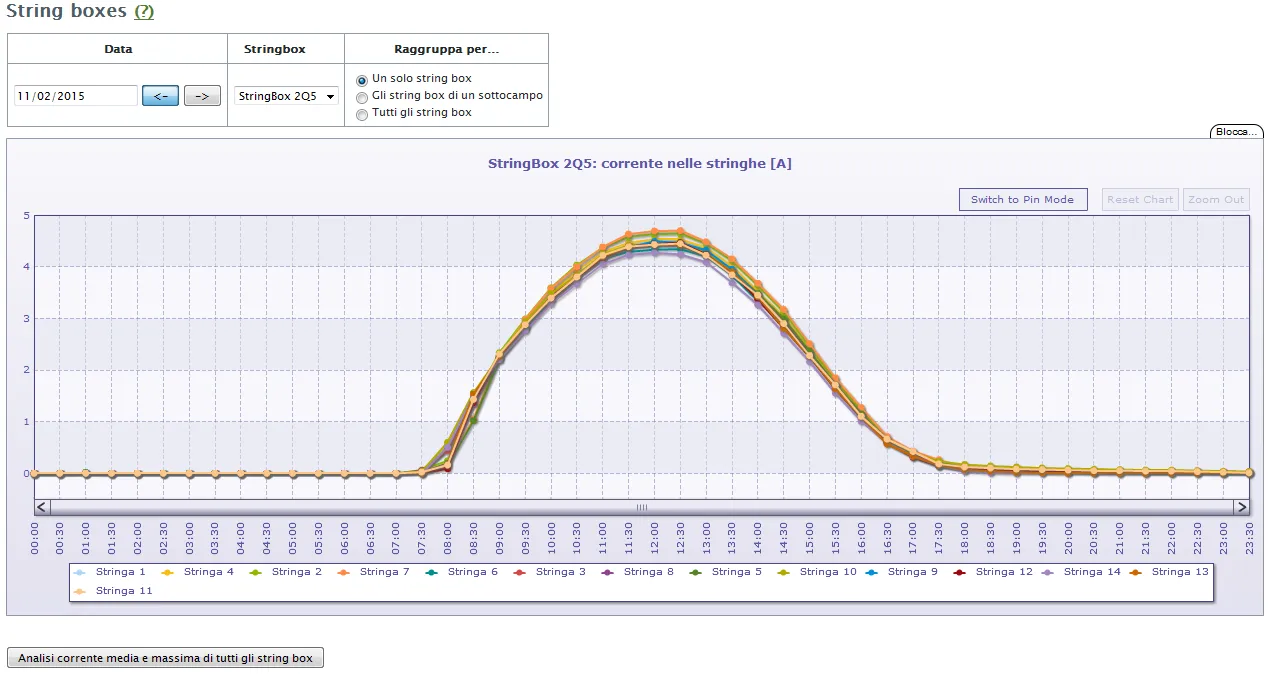
On the left, one inverter across a day: DC and AC power, voltage, current and temperature on the same chart. On the right, the currents of the fourteen strings on one box, every fifteen minutes — this is how a string behaving badly stands out. Interface shown in Italian.
Performance ratio
What it yielded, against what it could have yielded.
Performance is measured to CEI 82-25. It is not a ratio between two raw numbers: before comparing them, the calculation accounts for everything that changed the result on that day, at that site.
- Expected
- Measured
- Shortfall
Expected yield against measured. Reading the plant continuously makes the afternoon shortfall visible; sampling would have averaged it away.
What the calculation accounts for
- 1 Exact sunrise and sunset times
- 2 Annual ageing of the plant
- 3 Direct and diffuse irradiation
- 4 Panel tilt
- 5 Time of day
- 6 Monthly mean irradiation
The chart shows the daily figure and the progressive decay in efficiency since the plant was commissioned. That is the curve you need to tell ordinary ageing from a problem.
powerPV The performance ratio, day by day
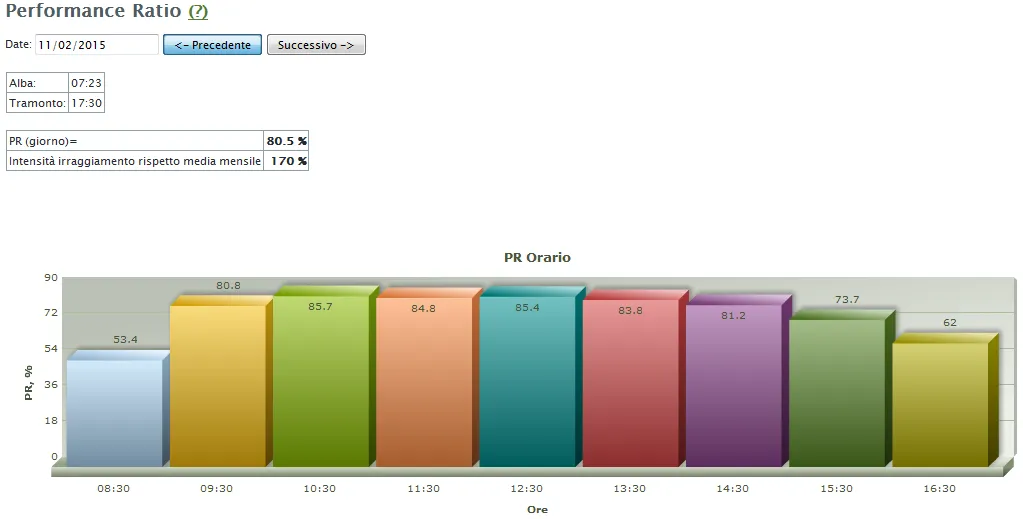
The performance ratio computed to CEI 82-25, with sunrise and sunset times and the irradiation intensity against the monthly mean. The bars are the ratio hour by hour: the same reading the panel above condenses into one number. Interface shown in Italian.
Reports and alarms
The system writes to you. Nobody has to remember to look.
Monitoring is worth having only if it produces a decision. So the system sends, flags and summarises rather than merely collecting.
-
Daily report
An email each day with the energy produced and the previous days beside it, for an immediate comparison. If something has changed, you see it the next morning.
-
Automatic alert
On a fault or a shutdown, a notification names the type of malfunction and the device involved: you set out already knowing what you are going to do.
-
Notification register
Every notification in chronological order, separated into cleared and still active. With the history in front of you, a fault that returns every three weeks stops looking like bad luck.
-
Monthly report
The comparison between expected and measured performance, making it unambiguous how much of the gap is the irradiation and how much is the plant. It is the document you take into a meeting.
| Month | Irradiation kWh/m² | Expected MWh | Measured MWh | Shortfall | PR |
|---|---|---|---|---|---|
| Jan | 42.1 | 38.4 | 37.9 | -1.3 % | 0.81 |
| Feb | 58.6 | 53.7 | 53.1 | -1.1 % | 0.81 |
| Mar | 96.4 | 88.9 | 87.6 | -1.5 % | 0.81 |
| Apr | 124.8 | 114.1 | 108.3 | -5.1 % — Shortfall over threshold | 0.78 |
| May | 148.2 | 133.9 | 121.4 | -9.3 % — Shortfall over threshold | 0.74 |
| Jun | 161.7 | 144.2 | 128.9 | -10.6 % — Shortfall over threshold | 0.73 |
powerPV Production register and monthly comparison
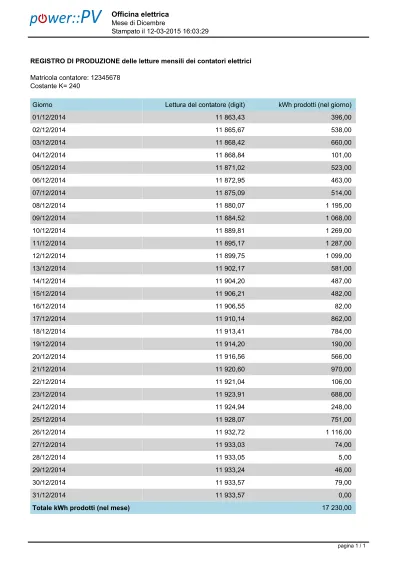
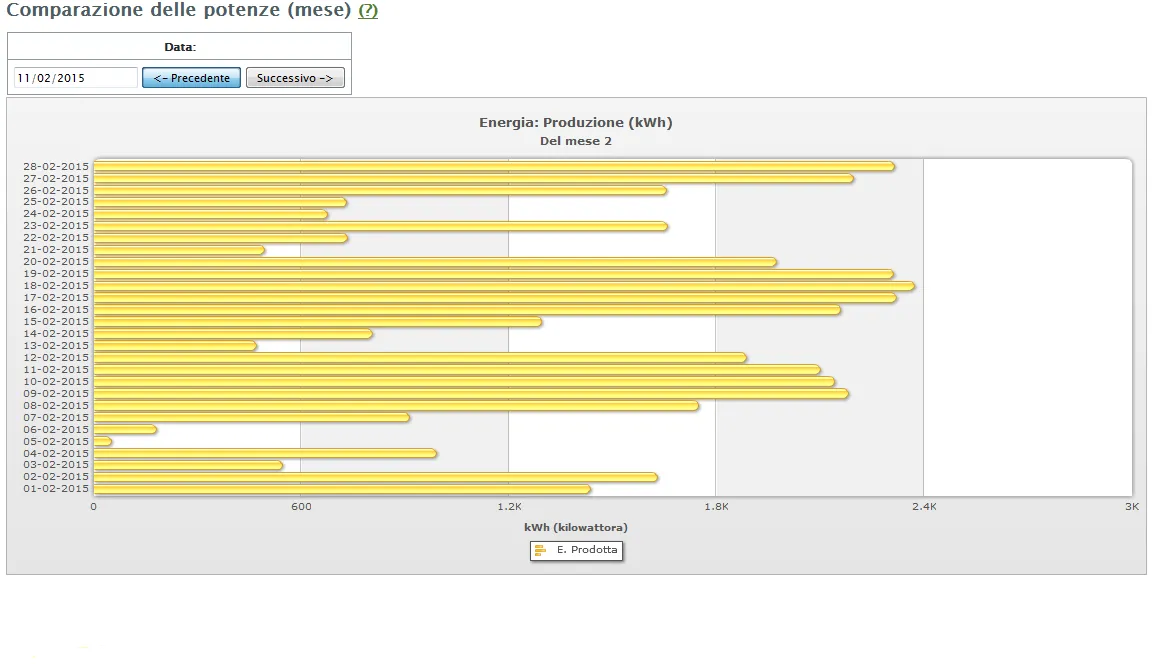
On the left, the meter reading register, day by day, with the month’s total: the document you need when production has to be proved rather than merely watched. On the right, the yield of every day in the same month, so a bad day is immediately visible. Interface shown in Italian.
| No. | Opened | Closed | Device | Fault |
|---|---|---|---|---|
| 122533 | 30/01 11:15 | 31/01 09:45 | Reference meter | No yield from plant |
| 122412 | 02/02 09:05 | 02/02 09:25 | Field controller | Link to the plant lost |
| 122390 | 14/02 06:40 | 14/02 07:05 | Field controller | Link to the plant lost |
| 122604 | 21/02 13:20 | Active | Inverter 2 | Inverter tripped |
powerPV The notification register, with the real history
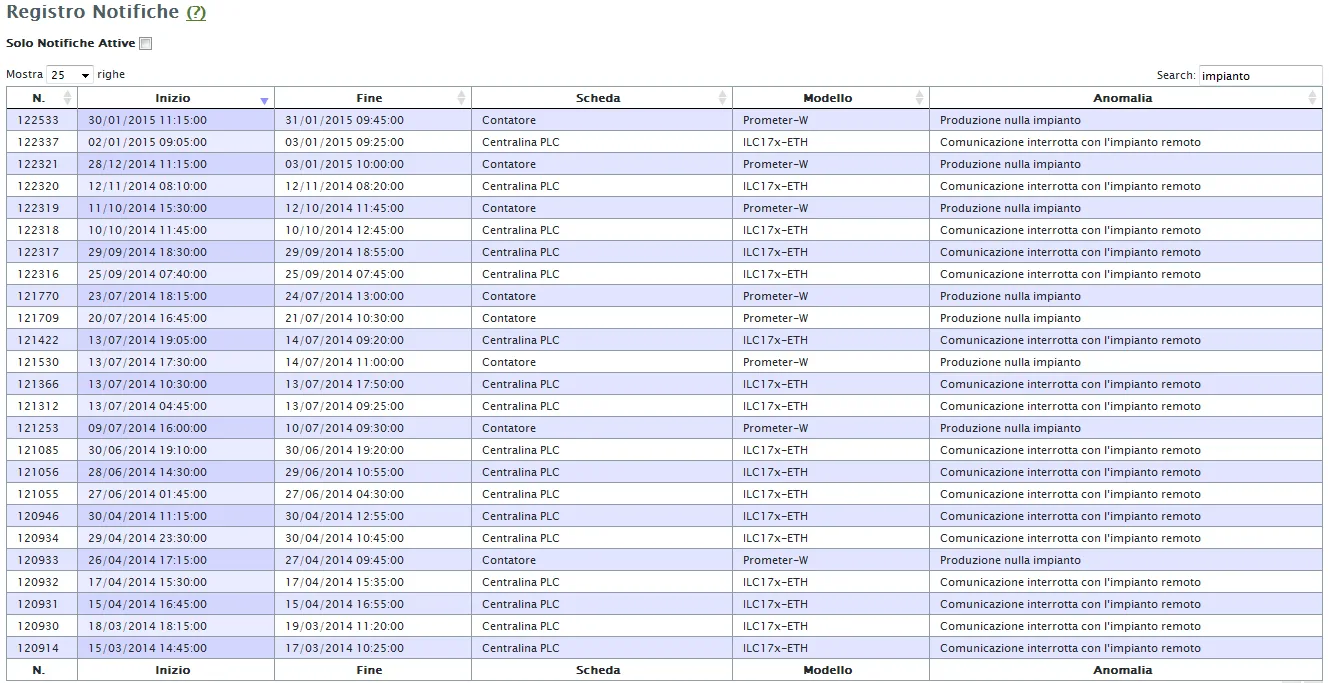
Notifications in chronological order, with the start, the end, and the board and model of the device involved. Years of history on a real plant: most of it is a lost link or no yield, which is exactly what actually happens. The row count has been removed. Interface shown in Italian.
Field measurements
When the numbers say something is wrong, someone goes and looks.
A photovoltaic plant is a complex, interacting system: the data says where to look, but the first sign of deterioration is confirmed with an instrument in hand. These are the checks we offer.
-
Thermography
Finds hot spots and dead cells, blocked airflow, local shading.
-
I/V curve analysis
A precise check on the suspect modules — the ones the data has already put under observation.
-
AC and DC checks
The measurements the standard prescribes, carried out and recorded.
-
Electroluminescence
A laboratory test: it shows microcracks and breaks that no electrical measurement in the field reveals.
-
PID check
Potential induced degradation: we establish whether it is happening and act on it with the appropriate grounding measures.
Operation & maintenance
Several photovoltaic parks are ours to run.
Not only the software: we operate and maintain several parks ourselves. The plant is watched remotely by our engineers on the powerPV platform and, on a serious malfunction, we immediately alert a local technician — within twenty kilometres of the site — to restore it.
- Inverter tests
- Protection breaker tests
- Torque checks
- Equipment cleaning
- Module cleaning
Obligations
Remote reading, and who has to have it.
Italian energy authority resolutions require producers to install a modem for remote data reading. It applies to low and medium voltage alike, and failing to comply means GSE incentives are temporarily revoked.
-
Who it applies to
Plants above 20 kW nominal power whose meter was installed by the producer — that is, by the owner of the plant, or whoever operates it.
-
What we do
Supply and configuration of the modem, installation on site, and filing the plant’s details on the distributor’s portal. If an optoisolated serial converter or a higher-gain antenna for partial coverage is needed, it comes in the same supply.
Questions
What we get asked first.
Does it work with the inverters I already have?
Yes. The field controller talks to the plant’s digital nodes through their own protocols, and the expansions are chosen to match what is there. No inverter and no string box has to be replaced.
Does the plant have to be stopped to install it?
No. The system sits alongside the plant: it reads signals that already exist and adds the environmental sensors that are missing. It does not enter the conversion chain.
What size of plant is worth monitoring this way?
From a plant with a single controller up to parks above a megawatt peak, where several field controllers talk over a local network. What changes is how many nodes there are, not which system is used.
Who sees the data?
Whoever holds credentials. User profiles carry differentiated levels of functionality, so the owner, the operator and the maintainer can each be given different access to the same plant.
Can you run the plant for us?
Yes, and it is what we do on several parks. Remote observation by our engineers, annual tests on the equipment, and a local technician alerted at once when the fault is a blocking one.
Is it worth washing the modules?
Most of the time no, and the irradiation sensors on the plants we maintain prove it: the cost of the job exceeds the yield recovered. On a measured plant the question has a numerical answer, and it differs from site to site.
Let us read your plant for a month and see what comes out.
Request a demo